


How to measure your Digital Brand Awareness?
Introduction:
In the digital world where the consumer is faced with massive digital clutter, driving Brand awareness initiatives, and measuring your Brand awareness, seems to be a mammoth task. By continuously tracking your Brand Awareness you will be able to analyze what is working well for your brand or not & strategize accordingly.
How often should you perform a Digital Brand awareness?
The answer varies from Brand to brand. This exercise typically involves a lot of time & resources & many organizations prefer performing this exercise to support their Strategic annual Marketing initiatives. However, one can regularly perform these exercises to detect changes in audience attitudes, opinions & behaviors with the help of several online tools.
How do you measure Brand Awareness?
1. Analyze your Website Traffic (just Google Analytics it!)
Keep an eye on your Traffic numbers especially on Direct Traffic (members typing your website URL in the address bar or have bookmarked your website or have landed on your site after clicking on an email link). Monitoring this over time will give you an indication on any changes in your Brand awareness. But remember to use this metric directionally!
Organic Traffic is another metric that can be analyzed over time. It gives you an indication on how many people are searching your brand name & the prevalent brand recognition in the market.
2. Monitoring Brand Share
Taking the reference from Brand Share Dimensions (Digital Marketing Analytics, 2nd Edition – , there are 3 main components that contribute to a Brand’s share:
• Share of Voice
• Share of Search
• Share of Audience
Brand Conversation Share:
The Share of Voice will help us in gain insight on how much of the total conversation about a category a brand might occupy. There are many Social listening tools available that can help you calculate these numbers.
In the below table Brand 1 clearly captures most of the share of voice for a specific category of Retro cruiser Motorcycles. However, SOV can fluctuate over time and hence Trending SOV numbers will provider sharper insights on your Brand awareness initiatives.
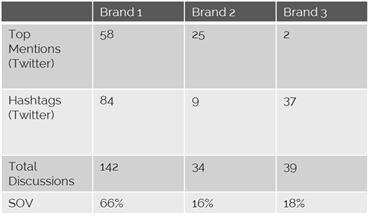
Fig 1 – SOV for Retro cruiser Motorcycles Brands
Brand Searches Share:
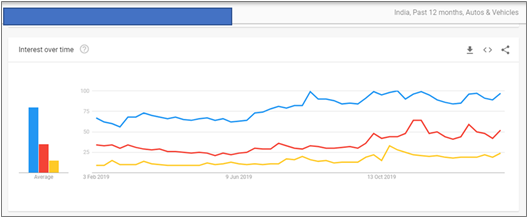
This metric will indicate how many searches within a category are about the brand.
Here 3 different brands have been analyzed offering the similar product category. You can compare your performance with your competitors as well. Google Trends is a fantastic tool that gives you powerful insights without the information overload. However, for startups this tool may not be able to provide you insights because google needs to collate a substantial amount of data to reflect in these reports.
If you are new to Google Trends, Check out our Blog on how you can use Google Trends for your Digital Marketing initiatives
Fig 1.1 – Google Trends Interest over time for 3 brands
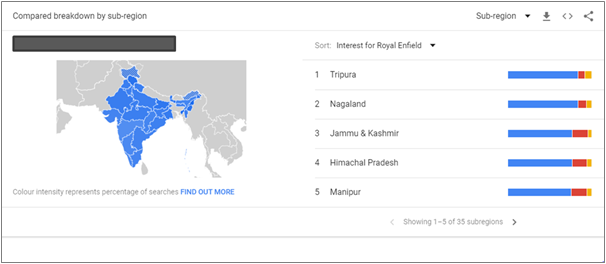
SOS can also be broken down and further filtered on geography. This will help you identify untapped geographies for your business (Fig 1.2)
Fig 1.2 – Google Trends Breakdown by sub-region
Brand’s Audience Share:
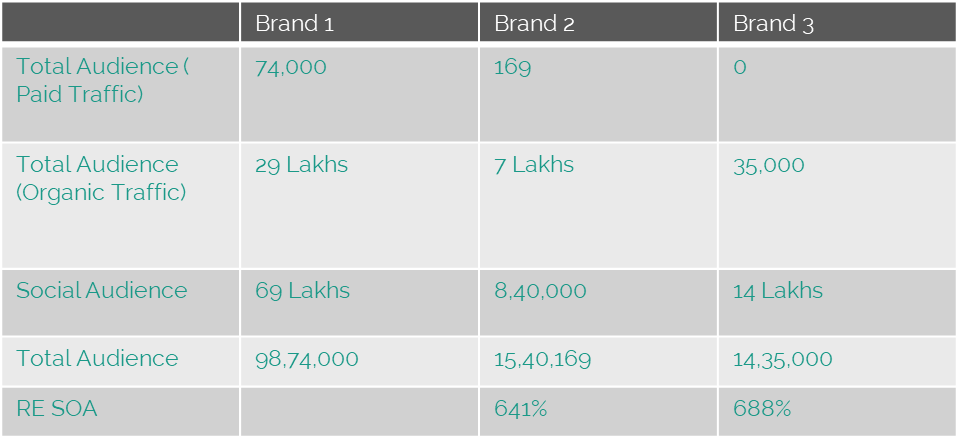
Assuming that we are looking at only the digital properties, we can summarize the total audience and calculate the SOA for each competitor using your tool of preference.
Rival IQ is one great tool that can give you these numbers. You can also collate Paid Traffic data from tools like SEM Rush and create the below format (Fig 1.3)
Fig 1.3 – Category SOA Calculation
3. Monitoring your Audience Reach & Engagement:
It is important to analyze your Audience reach and their levels of engagement. Using different data from different sources like Website Analytics (Eg Google Analytics), Social Media Analytics (FB Insights, Linkedin Analytics, Rival IQ etc), email marketing analytics (Mailchimp) will help you bring together a total audience view.
Audience Engagement is another important metrics to capture. Rival IQ can provide you a holistic view specifically on your Social Audience. You can compare your Brand’s performance with your competitors as well across multiple social Media platforms.
Fig 1.4 – Rival IQ Report on Total Social Audience
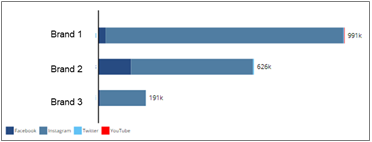
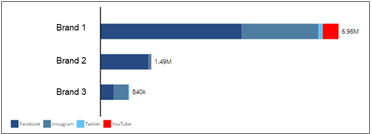
Fig 1.5 – Rival IQ Report on Total Social Engagement
Conclusion:
There are multiple approaches that can be used to help you determine your Brand’s Health at a high level. With a plethora of tools available you can build a reliable view of your Brand Health and accordingly decide your Plan of action. Do keep in mind the context while calculating & interpreting the above metrics & your brand health.
Blog disclaimer:
This is a professional weblog, and we have invited experts to share their thoughts, expertise , perspectives and knowledge. The opinions expressed here are purely representing their personal views and not those of any institution, employer or company.

