


What is DAX in Power BI?
DAX stands for Data Analysis Expressions.
DAX is a collection of functions, operators, and constants that can be used in a formula, or expression, to calculate and return one or more values. In simple words, DAX helps us to create new information from data already present in the model.*
Functions can contain other nested functions, conditional statements, and value references.
Execution starts from the innermost function or parameter and works outward.
Why DAX?
We create reports that show valuable insights without using any DAX formulas. But If we need to analyze trends and different insights, we can’t do it without any calculation. To analyze growth across product categories over different date ranges. Or need to calculate periodic growth compared to market trends? DAX formulas provide these calculations and many other important calculations as well in the form of calculated columns, measures, quick measures.
There are two types of calculations using DAX:
- Calculated columns
- Calculated measures
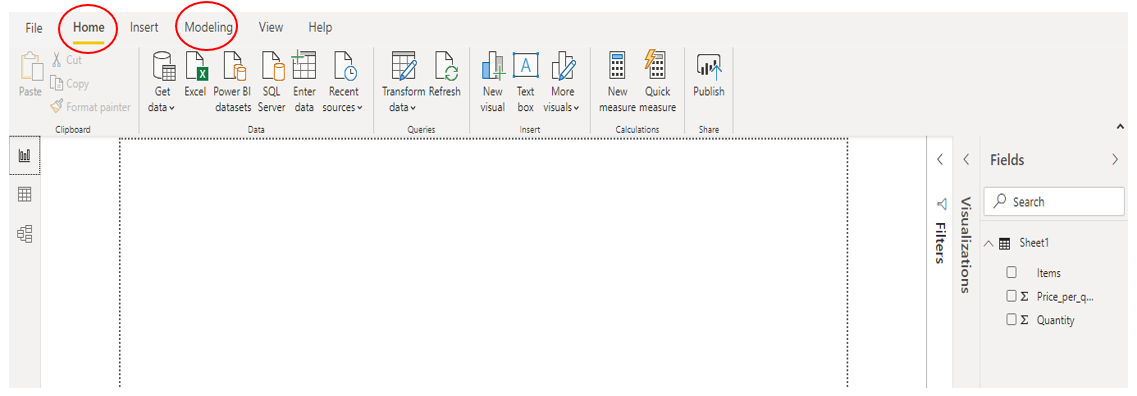
We can create calculated columns or calculated measures in Power BI Desktop by selecting New Column from the Modeling tab or from the Home tab.
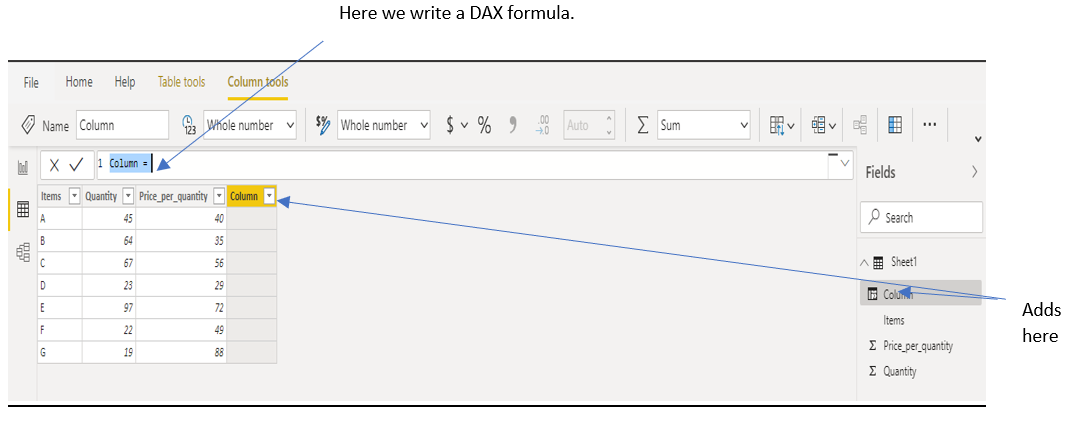
Calculated columns are useful when we want to slice or filter on the value,
Select the New Column button, the Formula Bar is populated with a basic column name (which we change according to the formula) that can be renamed as per requirement and the = operator, and the new column appears in the data grid.
The required elements for a calculated column are the following:
- a new column names
- at least one function or expression
In calculated columns, we can use calculated measures and combinations of many functions in a single formula. For example, we can use calculate function, aggregate function, if function and filter function together.
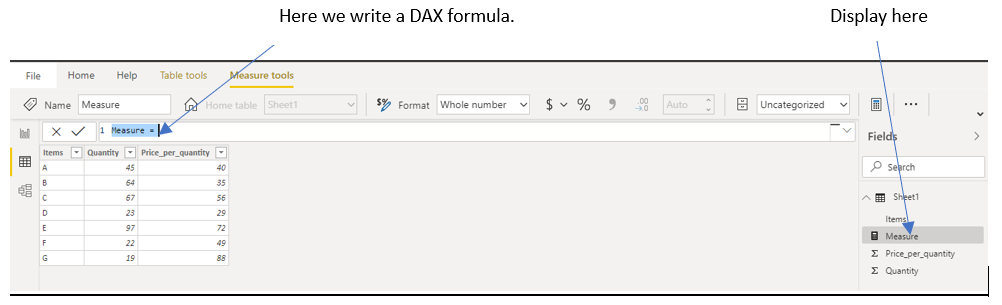
Calculated measures are used when we are calculating percentages or ratios, or need complex aggregations. To create a measure using a DAX formula, select the New Measure button. We see a new measure icon appear in the Fields pane with the name of the measure.
With DAX, there are many functions available to shape, form, or analyze our data. These functions can be grouped into a following of categories:
- Aggregation functions
- Counting functions
- Logical functions
- Information functions
- Text functions
- Date functions
When we start writing formula into the Formula Bar, a list of available functions appears to select. And by using the up and down arrow keys, highlight any of the available functions, and a brief description is displayed.
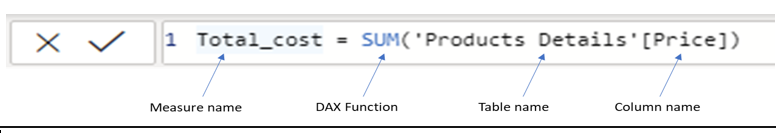
Let’s understand it with example:
Note- It displays the functions that match the letters typed so far, so if we type R – functions that begin with R appear in the list. If we type Ra- only functions that contain the letter sequence Ra in their name appear in the list.
Can you also explain the filter and row context with examples?
We can create any logically sound DAX formula by using the existing columns and tables in your Power BI to make more detailed and advanced reports. With a combination of different functions in DAX, Power BI paves the way to make calculations easier to get key insights for different datasets.
Blog disclaimer:
This is a professional weblog, and we have invited experts to share their thoughts, expertise , perspectives and knowledge. The opinions expressed here are purely representing their personal views and not those of any institution, employer or company.


