Since 2015, our data analytics trainings and services have enabled enterprises in transforming their legacy reports, data analysis and dashboards by leveraging Microsoft Data and AI technologies.
We provide services supporting enterprise data warehousing, business intelligence, and data analytics solutions across Retail, Manufacturing, Pharma, Transportation, and Financial services sectors.
Years of Service
0+
Client Engagements
0+
Hours of Training
0+
Professionals Upskilled
0+
B-Schools and Institutes
0+
Our Data Analytics Services
Consulting Services
Consultancy on data architecture and data analytics roadmap.
Dashboard as a Service
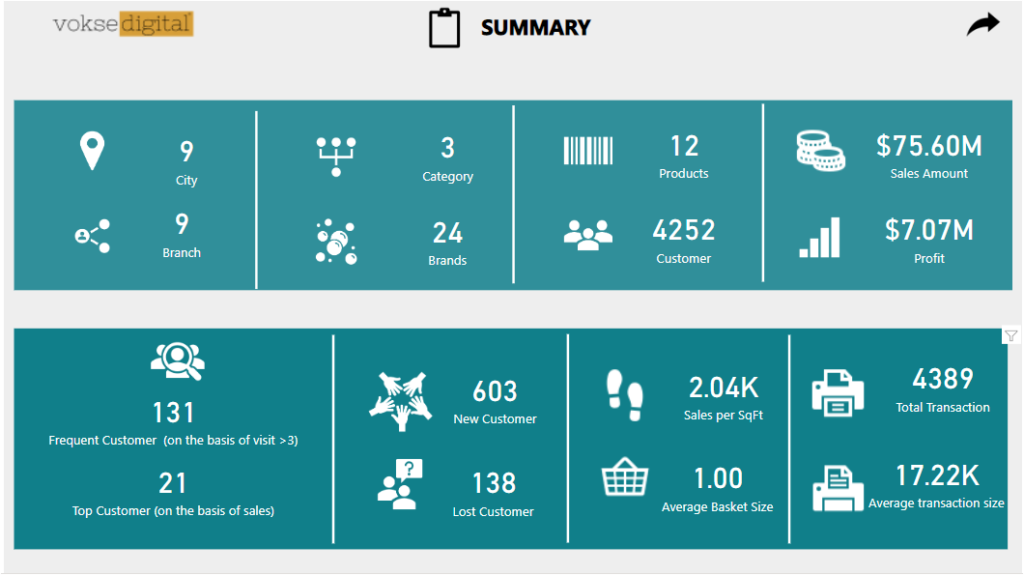
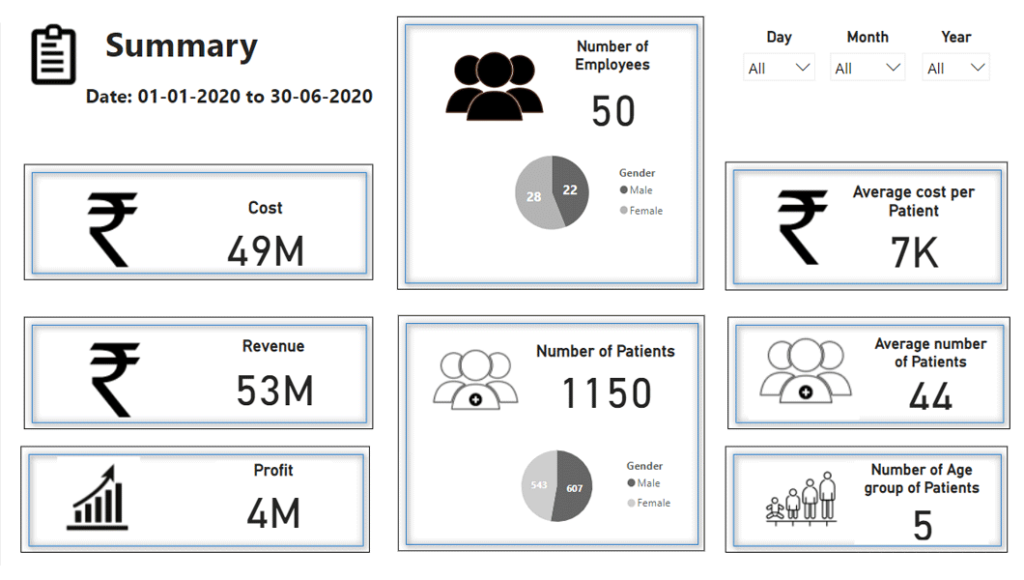
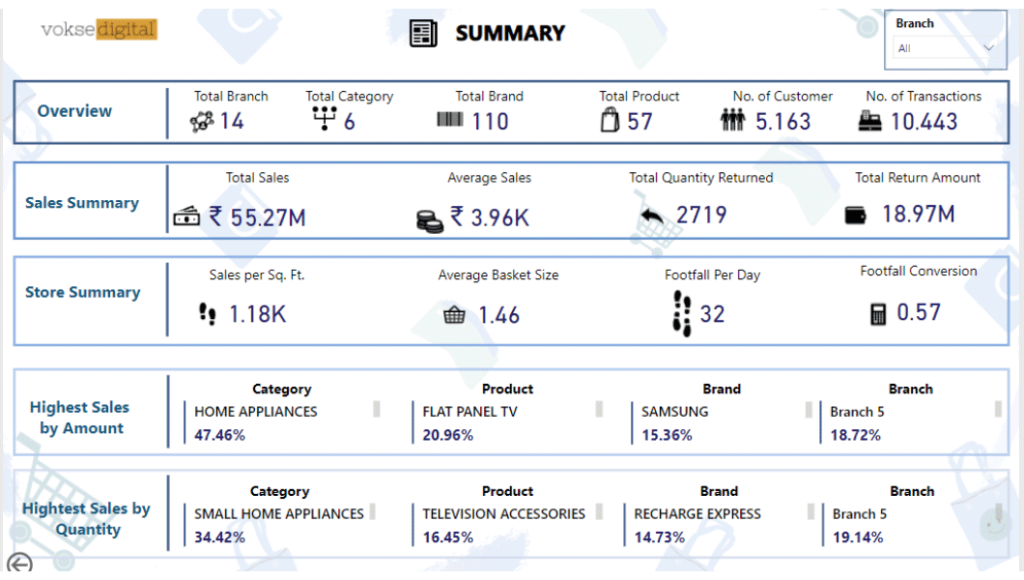
Design and development of Power BI dashboards based on customer specific requirements.
Shared Services
Support for data analytics from our pool of resources for identified areas such as data pipeline, dashboard migration, insights building with Power BI and much more.
Managed Services
Data Engineering and ETL services and end to end Power BI implementation, testing, training and support of solution to make BI self-service.
Resource Augmentation
Support for resources with specific skill sets on data analytics and data science.
Our Training Services
Data Analytics learning intervention for enterprises, by providing a powerful and easy to use blended learning program for re-skilling & up-skilling of larger workforce embedded with FACE TIME , online training, projects & deep mentoring.
We are a Microsoft Training Services Partner and our data analytics trainings delivered by Microsoft Certified Trainers help enterprises upskill their workforce on technologies of Power BI, Azure Data Factory, SQL, Excel, Power Apps, Power Automate and Fabric
For corporate trainings on Data Analytics and AI , please write to info@voksedigital.com
For Retail trainings , please explore our courses: